Chin. Phys. Lett. (2022) 39(9) 093202 - Measurements of Dipole Moments for the $5{s}5{p}\,^3\!{P}_1$--$5{s}n{s}\, ^3\!{S}_1$ Transitions via Autler--天下网标王
Chinese Physics Letters, 2022, Vol. 39, No. 9, Article code 093202 Measurements of Dipole Moments for the $5{s}5{p}\,^3\!{P}_1$–$5{s}n{s}\, ^3\!{S}_1$ Transitions via Autler–Townes Spectroscopy Canzhu Tan1,2, Fachao Hu1,2, Zhijing Niu1,2†, Yuhai Jiang2,3*, Matthias Weidemüller1,2,4*, and Bing Zhu2,4,5* Affiliations 1Hefei National Laboratory for Physical Sciences at the Microscale, University of Science and Technology of China, Hefei 230026, China 2CAS Center For Excellence in Quantum Information and Quantum Physics, University of Science and Technology of China, Hefei 230026, China 3Center for Transformative Science and School of Physical Science and Technology, ShanghaiTech University, Shanghai 201210, China 4Physikalisches Institut, Universität Heidelberg, Im Neuenheimer Feld 226, 69120 Heidelberg, Germany 5HSBC Lab-China, Guangzhou 510620, China Received 30 June 2022; accepted manuscript online 11 August 2022; published online 29 August 2022 Current address: Department of Physics, University of Colorado Boulder
*Corresponding authors. Email: jiangyh@sari.ac.cn; weidemueller@uni-heidelberg.de; bzhu1990@gmail.com
Citation Text: Tan C, Hu F, Niu Z et al. 2022 Chin. Phys. Lett. 39 093202    Abstract We report on experimental measurements of the transition dipole moments (TDMs) between the intermediate state $5{s}5{p}\, ^3\!{P}_1$ and the triplet Rydberg series $5{s}n{s}\, ^3\!{S}_1$ in an ultracold strontium gas. Here $n$ is the principal quantum number ranging from 19 to 40. The transition $5{s}5{p}\, ^3\!{P}_1$–$5{s}n{s}\, ^3\!{S}_1$ is coupled via an ultraviolet (UV) beam, inducing Autler–Townes splitting of both states. Such a splitting of the intermediate state is spectroscopically measured by using absorption imaging on a narrow transition $5{s^2}\, ^1{S}_0$–$5{s}5{p}\, ^3\!{P}_1$ in an ultracold gas of strontium atoms. The power and size of the UV beam are carefully determined, with which the TDMs are extracted from the measured Autler–Townes splitting. The experimentally obtained TDMs are compared to the calculations based on a parametric core potential, on a Coulomb potential with quantum defect, and on the open-source library Alkali Ryderg calculator, finding good agreement with the former two models and significant deviation with the latter.
cpl-39-9-093202-fig1.png
cpl-39-9-093202-fig2.png
cpl-39-9-093202-fig3.png
cpl-39-9-093202-fig4.png
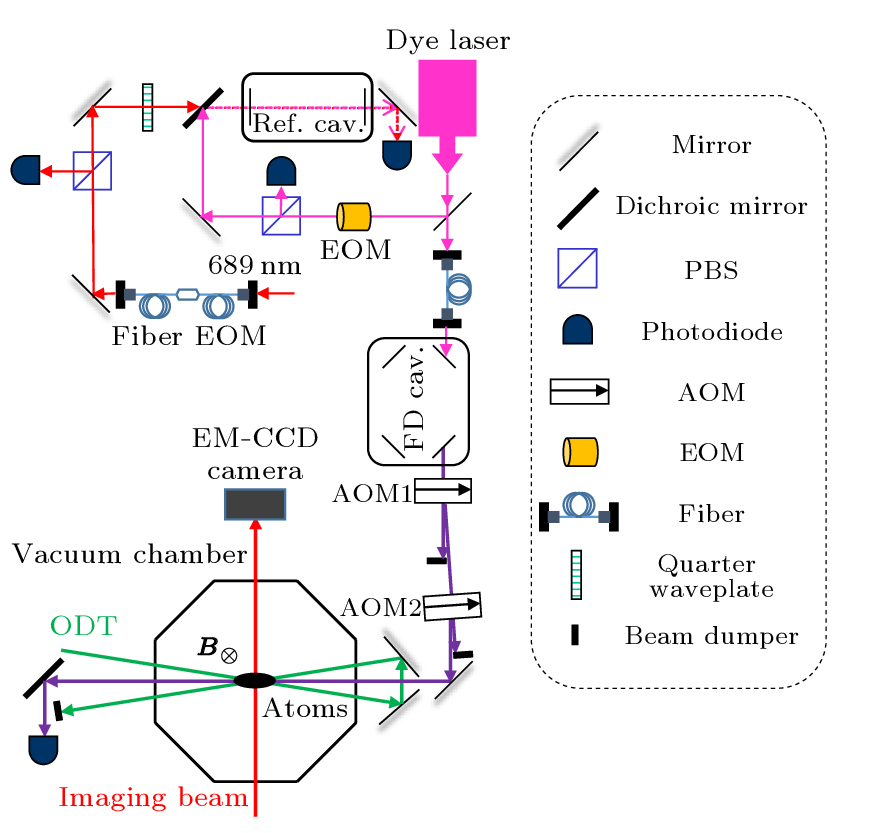
DOI:10.1088/0256-307X/39/9/093202 © 2022 Chinese Physics Society Article Text Rydberg atoms have many exaggerated properties,[1] e.g., the scaling of level energy, wavefunction, lifetime, and atom-atom interaction, with the principal quantum number $n$, enabling them active research frontiers in the fields of quantum simulations,[2,3] quantum information and quantum computing,[4] and emerging quantum technologies.[5] The study of Rydberg structure dates back to the early days of quantum mechanics in the context of quantitative atomic spectroscopy.[6] Nowadays, both single-particle properties and pairwise interactions for Rydberg states of alkali atoms can be routinely calculated using open-source libraries such as Alkali Ryderg calculator (ARC)[7] and Pairinteraction.[8] Recent developments of Rydberg physics with divalent atoms have been reviewed by Ref. [9]. Realizing strong and controllable couplings to one or several highly excited Rydberg states from a low-lying ground state using lasers is crucial in many aforementioned applications of Rydberg atoms. The coupling strength can be predicted quite accurately for alkali atoms using theoretical calculations based on the single-active-electron (SAE) approximation, such as pure Coulomb[10] or realistic model potentials,[7,11] and semi-classical method.[12] The SAE approximation is in general problematic for divalent atoms due to the large open-shell core polarizability and the existence of so-called doubly-excited “perturbers” there.[9] Nevertheless, the properties of highly excited Rydberg states in divalent atoms can be estimated using SAE methods in many cases,[13,14] while for observables involving low-lying states, theoretical methods taking two-electron correlations into consideration, such as configuration interaction expansion with a two-active-electron approximation[15] and multi-channel quantum defect theory,[16] are needed. In this work, we report on systematic measurements of transition dipole moments (TDMs) of the $5{s}5{p}\, ^3\!{P}_1$–$5{s}n{s}\, ^3\!{S}_1$ transitions in divalent strontium via Autler–Townes (AT) spectroscopy.[17] By performing absorption imaging on the narrow $5{s^2}\, ^1{S}_0$–$5{s}5{p}\, ^3\!{P}_1$ transition,[18] we probe the AT splitting of the meta-stable (lifetime $\sim$$21\,µ$s) $5{s}5{p}\, ^3\!{P}_1$ state being coupled to the triplet Rydberg series $5{s}n{s}\, ^3\!{S}_1$ through an ultraviolet (UV) beam. Splittings as small as 150 kHz with a typical width of 200 kHz (FWHM, full width at half maximum) are measured with the principal quantum number $n$ in the range of $19\le n\le40$. The measured TDMs are compared to three different theoretical calculations, two of which use the SAE approximation and agree quite well with our experimental results. Measuring TDMs of optical transitions via AT spectroscopy has been used in alkali[17,19] and molecular[20] systems and the extension to divalent atoms is performed here for the first time. Compared to other experimental methods of determining TDMs such as lifetime measurements, the AT-spectroscopy method directly accesses the TDMs without perturbations from systematic uncertainties.[21] In this Letter, the experiments are described first, including the experimental apparatus, the spectroscopic measurements, and the analysis to extract the $n$-dependent TDMs. Then, the theoretical calculation and the comparison to experiments are presented. Finally, we give conclusions. Experiments. Our experimental apparatus for laser cooling and trapping of strontium atoms has been described before in Refs. [22,23,24]. Briefly, $^{88}$Sr atoms loaded from a two-dimensional magneto-optical trap (MOT)[22] are collected and cooled in a two-stage three-dimensional MOT operating on the broad $5{s^2}\, ^1{S}_0$–$5{s}5{p}\, ^1{P}_1$ and narrow $5{s^2}\, ^1{S}_0$–$5{s}5{p}\, ^3\!{P}_1$ transitions, respectively. At the end of the narrow-line MOT, a crossed optical dipole trap (ODT) at 532 nm is switched on to provide further trapping after the MOT phase. We hold the atoms in the ODT for several hundreds of milliseconds, after which a cloud of $10^{5}$ atoms at 1 µK is typically obtained. The two ODT beams cross at an angle of 18$^{\circ}$ [as illustrated in Fig. 1, resulting a typical atom cloud size of (27, 69, 27) µm and a peak density of $7\times10^{11}$ cm$^{-3}$. Considering our stainless steel vacuum chamber with no nonconducting surfaces close to the atomic cloud,[25] we can ignore the effects of stray dc electric fields in all following experiments.
cpl-39-9-093202-fig1.png
Fig. 1. Experimental setup. PBS: polarizing beam-splitter, AOM: acousto-optic modulator, EOM: electro-optic modulator, FD cav.: frequency-doubling cavity, Ref. cav.: reference cavity.
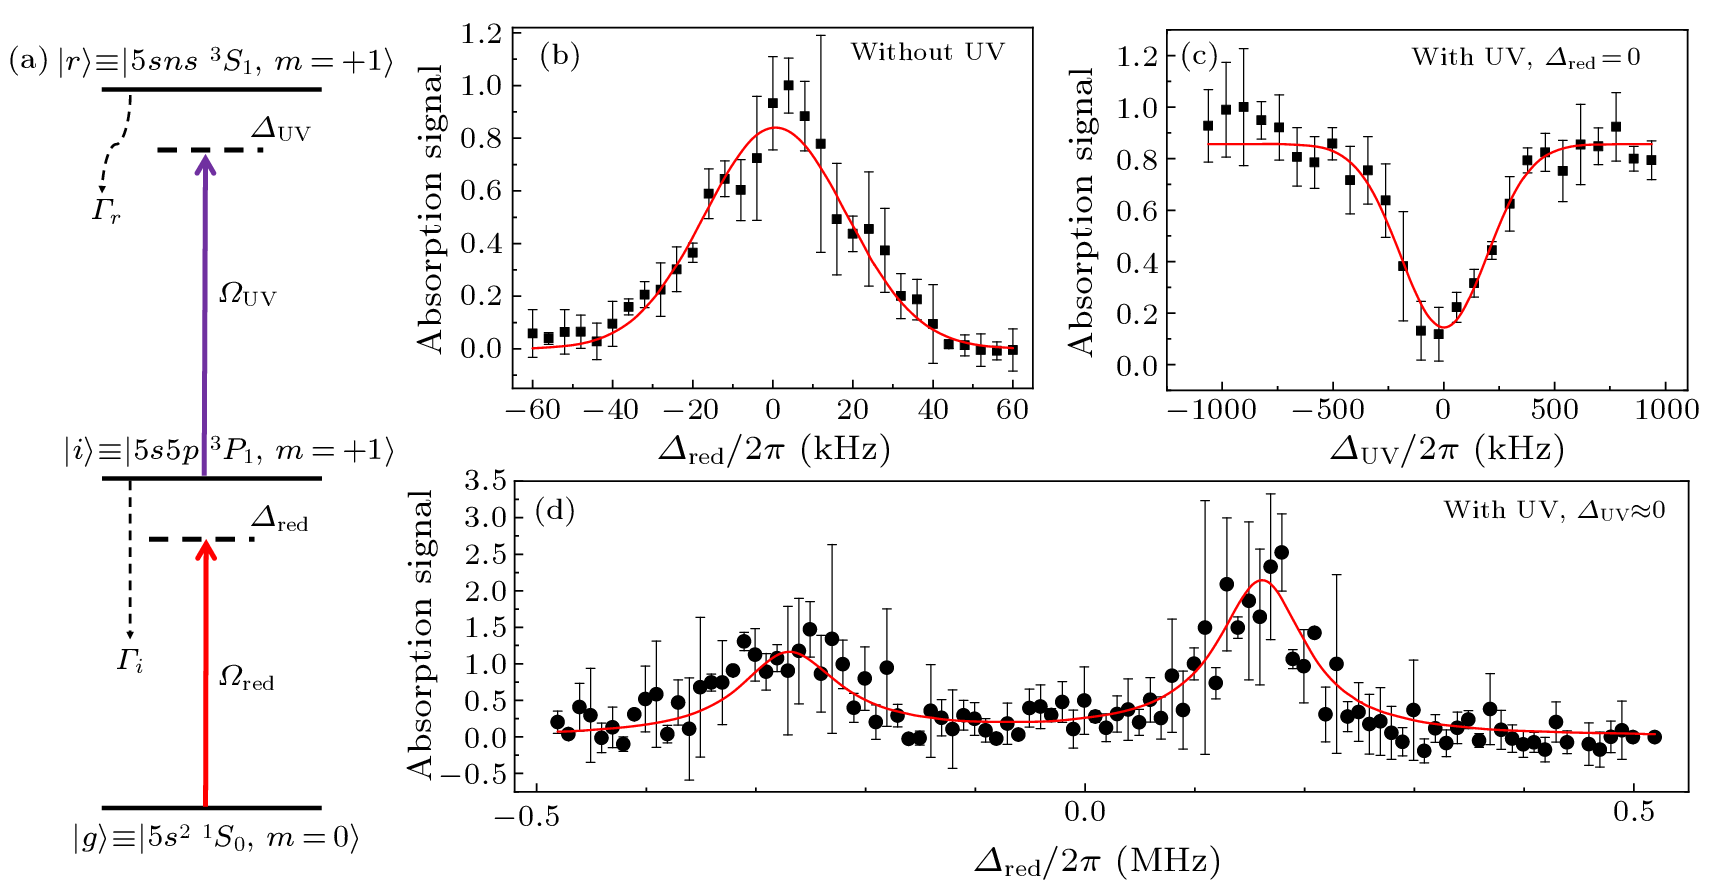
The triplet Rydberg series $5{s}n{s}\, ^3\!{S}_1$ ($\equiv|r\rangle$) has been spectroscopically studied in our recent work,[25] where a two-photon excitation scheme as shown in Fig. 2(a) was employed. The first photon at 689 nm driving the transition between the ground state $5{s}^2\, ^1{S}_0$ ($\equiv|g\rangle$) and the meta-stable state $5{s}5{p}\, ^3\!{P}_1$ ($\equiv|i\rangle$) is delivered from the narrow-line cooling laser, which is locked to an ultra-stable cavity.[24] This laser has a line width smaller than 10 kHz and a daily drift of 8 kHz/day.[24] The Rydberg states $|r\rangle$ are coupled to $|i\rangle$ by a UV light at 319 nm generated from a frequency-doubled dye laser, which is frequency stabilized to a low-finesse reference cavity via the Pound–Drever–Hall (PDH) technique [see Fig. 1] resulting in a linewidth of about 100 kHz. In Ref. [25], we measured the energy of Rydberg states via the atom-loss spectroscopy, where the number of atoms in the narrow-line MOT was measured as a function of the UV frequency. However, the determination of the UV resonance is limited by the Rydberg–Rydberg interactions in the atom-loss spectra,[26,27] especially for higher $n$. To enable a finer tuning of the UV frequency as well as a better determination of the UV resonance, we implement the following two main upgrades compared to Ref. [25]: (i) As shown in Fig. 1, the length of reference cavity to which the dye laser locks is stabilized to a frequency-locked red light, where a fiber electro-optic modulator (EOM) is used to tune the cavity length, and hence the dye laser frequency. (ii) Instead of exciting enough Rydberg atoms to induce significant losses, here we measure the absorption properties on a weak probe beam through a cloud of ground state atoms in the presence of a strong UV light. Two acousto-optic modulators (AOM1 and AOM2 in Fig. 1) are inserted into the UV beam path to perform intensity stabilization (with AOM1) and fast switching (with AOM2). The absorption on the red beam is extracted with an EM-CCD camera (Andor iXon 897) using the standard absorption imaging sequence.[18] The narrowness of the 689-nm probe transition ($\sim$$2\pi\times7.5$ kHz) provides a sensitive measurement of both the UV resonance and the UV-induced ATS of $|i\rangle $. We have already studied in detail the narrow-line absorption spectrum without the presence of UV light in Ref. [18], which can be described well by a symmetric Voigt profile with a small imaging intensity. In Fig. 2(b) we show such a spectrum measured by a large red imaging beam (a $1/e^2$ diameter of 4.2 mm) with an intensity of about $0.1I_{\rm s}$, in which an FWHM of 40(2) kHz is observed. Here $I_{\rm s}=3\,µ$W/cm$^{2}$ is the saturation intensity for the $|g\rangle-|i\rangle$ transition. The observed spectrum width is dominated by the Doppler effect[18] and the position of the absorption peak represents the on-resonance condition of the red transition. The Rydberg spectrum is measured by monitoring the absorption of an on-resonance 689-nm light in the presence of a UV beam as a function of the UV frequency. Both the red and UV beams propagate horizontally and they cross each other perpendicularly at the position of the atomic cloud. An external magnetic field of about 1 G is applied vertically, giving rise to a Zeeman splitting of about $h\times 4.86$ MHz (8.10 MHz) for the $|i\rangle$ ($|r\rangle$) state. The UV beam is vertically polarized to drive the $\Delta m=0$ transition with $m$ being the magnetic quantum number. The linear polarization of the red beam is horizontal and the red frequency is tuned to be resonant with the $\Delta m=+1$ transition, as seen in Fig. 2(a). The UV beam is switched on before applying the red one and its frequency is scanned via the fiber EOM (see Fig. 1). As an example, a measurement for the $5{s}37{s}\,^3\!{S}_1$ state is shown in Fig. 2(c), where the same imaging conditions are used as in Fig. 2(b). We fit the spectrum to a Gaussian function to extract the resonance center and width. The UV resonance position is determined with an uncertainty of 13 kHz, and the FWHM is 461(32) kHz, which mainly comes from the UV power broadening (a Rabi frequency of about 350 kHz is used here). The minimum FWHM for such a spectrum we have obtained is about 200 kHz.
cpl-39-9-093202-fig2.png
Fig. 2. Autler–Townes Spectroscopy: (a) Energy level scheme. The Rydberg state $|r\rangle $ is coupled to the meta-stable state $|i\rangle$ by a UV beam with a Rabi frequency $\varOmega_{\scriptscriptstyle{\rm UV}}$ and a detuning $\varDelta_{\scriptscriptstyle{\rm UV}}$. The lower state is probed via a red imaging beam driving the $|g\rangle-|i\rangle $ transition with Rabi frequency $\varOmega_{\rm red}$ and detuning $\varDelta_{\rm red}$. State $|i\rangle$ decays to $|g\rangle$ with a rate of $\varGamma_{i}$ while the decay rate from the Rydberg state is $\varGamma_{r}$ including that to $|i\rangle$. (b) Narrow-line absorption spectrum without the UV beam. The spectrum is measured with an intensity of $0.1I_{\rm s}$ and an imaging time of 200 µs. The error bars represent the standard deviation of five repeated measurements. The solid line is a fit to the Voigt profile to extract the spectrum center and width. (c) Rydberg spectroscopy. The absorption signal is recorded as a function of the applied UV frequency while keeping the red transition on resonance ($\varDelta_{\rm red}=0$). The same imaging parameters used are the same as those in (b). The error bars are standard deviations of five measurements. A Gaussian function (solid line) is used to fit the spectrum to extract the on-resonance frequency of the UV transition and the corresponding width. See text for more details. (d) AT splitting of $|i\rangle$ induced by couplings to $|r\rangle$. The UV detuning is tuned to be close to resonance, and error bars are standard deviations of three repeats. The solid line is a fit to Eq. (1). See text for more details.
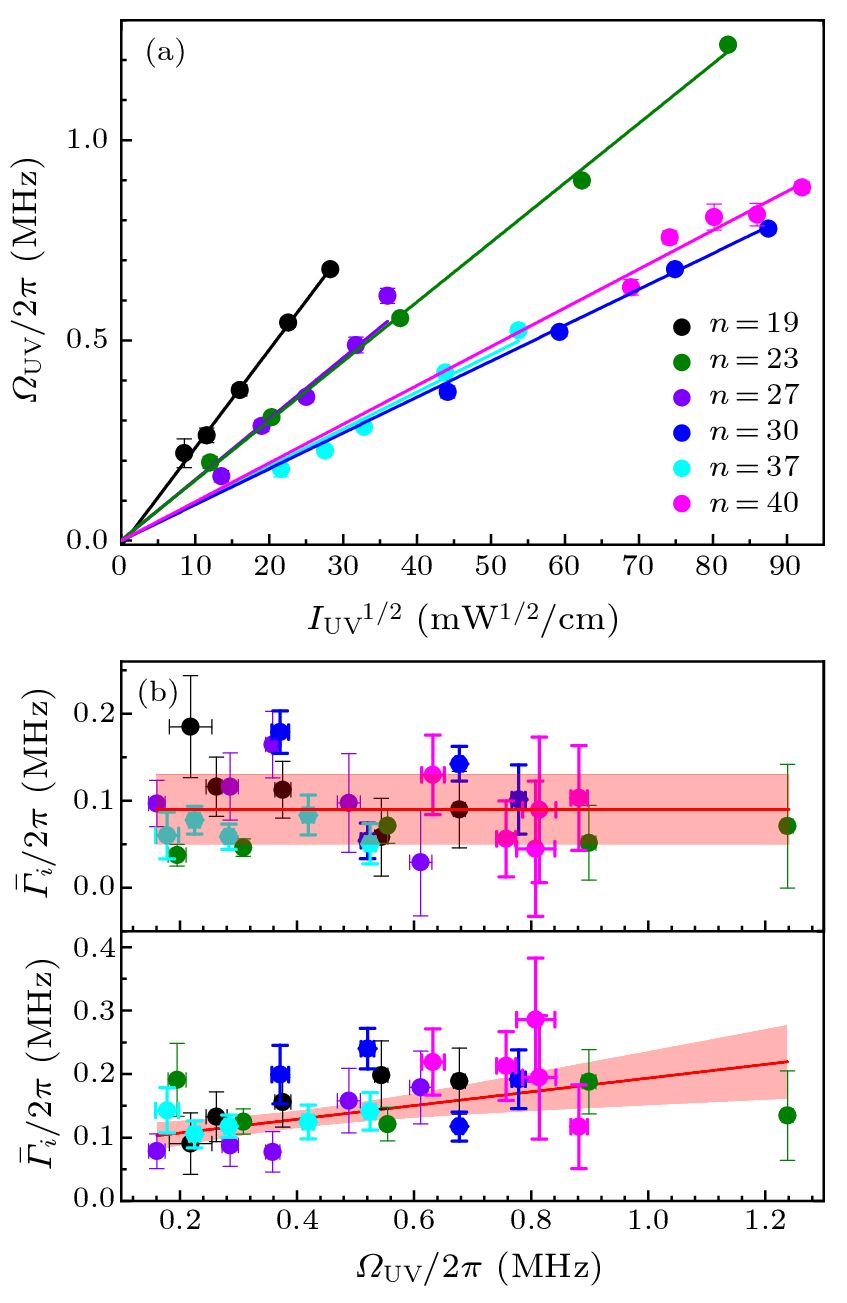
To characterize the coupling strength between $|i\rangle$ and $|r\rangle$, namely $\varOmega_{\scriptscriptstyle{\rm UV}}$, we measure the narrow-line absorption imaging spectrum in the presence of a strong UV beam. A typical line shape is shown in Fig. 2(d) for $n=37$, which is fitted to an analytic formula[28] \begin{align} \sigma\!\propto\!\frac{2(\bar{\varGamma}_{i}^2\bar{\varGamma}_{r}+4\bar{\varGamma}_{r}(\varDelta_{\rm red}+\varDelta_{\scriptscriptstyle{\rm UV}})^{2}+\bar{\varGamma}_{i}\varOmega_{\scriptscriptstyle{\rm UV}}^2)}{4(\bar{\varGamma}_{r}\varDelta_{\rm red} \!+\!\bar{\varGamma}_{r}\varDelta_{\scriptscriptstyle{\rm UV}})^{2}\!+\![\bar{\varGamma}_{r}\bar{\varGamma}_{i}\!-\!4\varDelta_{\rm red}(\varDelta_{\rm red}\!+\!\varDelta_{\scriptscriptstyle{\rm UV}})\!+\!\varOmega^{2}_{\scriptscriptstyle{\rm UV}}]^{2}},\tag {1} \end{align} where $\sigma$ represents the absorption cross section and $\bar{\varGamma}_{i}=\varGamma_{i}+\gamma_{\rm red}$ and $\bar{\varGamma}_{r}=\varGamma_{r}+\gamma_{\scriptscriptstyle{\rm UV}}$ are the coherence decay rates for the two transitions, respectively; $\gamma_{\rm red}$ and $\gamma_{\scriptscriptstyle{\rm UV}}$ represent the dephasing effects like laser frequency noises, magnetic field fluctuations, and Doppler effect. By using the above formula we neglect any interaction-induced effect in the measured spectrum, which will be confirmed in the Supplementary material. All the parameters in Eq. (1) are freely fitted, including the UV near-zero UV detuning $\varDelta_{\scriptscriptstyle{\rm UV}}$ to account for possible frequency drifts. From the fit we obtain $\varOmega_{\scriptscriptstyle{\rm UV}}/2\pi=1.24(1)$ MHz, $\varDelta_{\scriptscriptstyle{\rm UV}}/2\pi=0.072(6)$ MHz, $\bar{\varGamma}_{i}/2\pi=0.08(8)$ MHz, and $\bar{\varGamma}_{r}/2\pi=0.13(8)$ MHz. The measured UV-induced ATS $\varOmega_{\scriptscriptstyle{\rm UV}}$ is related to the UV intensity $I_{\scriptscriptstyle{\rm UV}}$ at the atomic cloud position via the TDM $\mu_n$ for the transition $|5{s}5{p}\,^3\!{P}_1, m_J=+1\rangle \rightarrow |5{s}n{s}\,^3\!{S}_1, m_J=+1\rangle$, which reads \begin{eqnarray} \varOmega_{\scriptscriptstyle{\rm UV}}(r) =\frac{\mu\sqrt{2I_{\scriptscriptstyle{\rm UV}}(r)/c\epsilon_0}}{\hbar}. \tag {2} \end{eqnarray} Here $c$ is the light speed in vacuum, $\epsilon_0$ is the vacuum permittivity, $\hbar$ is the reduced Planck constant, and $r$ is the atomic cloud position in the transverse direction. As plotted in Fig. 3(a), $\varOmega_{\scriptscriptstyle{\rm UV}}$ is measured as a function of $I_{\scriptscriptstyle{\rm UV}}$ for six different $n$. On the one hand, the UV beam intensity $I_{\scriptscriptstyle{\rm UV}}$ must be carefully calibrated to quantitatively extract the TDM by fitting the measurements to Eq. (2). On the other hand, the frequency-doubling cavity shown in Fig. 1 needs to be realigned each time when changing $n$, and thus the UV beam profile and power change accordingly. For each $n$, the UV power is recorded by a commercial power meter (S120VC, Thorlabs) with a measurement uncertainty of $5\%$. The UV beam profile $I_{\scriptscriptstyle{\rm UV}}(x, y)$ in the plain of the atomic position is measured by a commercial beam profiler (from DataRay) with a pixel size of 12.9 µm. Since the size of atomic cloud ($\sim$$27\,µ$m) is much smaller than the UV beam size ($\ge$$300\,µ$m), we can safely assume an uniform intensity across the atomic cloud. Although we have carefully aligned the UV beam by maximizing the measured $\varOmega_{\scriptscriptstyle{\rm UV}}$ at a fixed UV power, a largest deviation of $0.5w$ from the beam center is attributed to the atomic position, leading to a deviation of 30–50% of the maximum intensity. Here $w$ is the beam waist by fitting the measured intensity profile to a Gaussian one. The intensities shown in Fig. 3(a) are the mean values considering these deviations. The solid lines are fits to Eq. (2) and the TDMs are obtained as shown in Fig. 4. A further treatment taking into account the non-uniform atomic density distribution is presented in the Supplementary material, which gives a small correction ($\sim$10%) to the obtained intensity.
cpl-39-9-093202-fig3.png
Fig. 3. Extracting experimental TDMs: (a) Measurements of the intensity-dependent AT splitting for six different $n$. Solid lines are fits to Eq. (2) to extract the TDMs. (b) Decoherence rates as a function of $\varOmega_{\scriptscriptstyle{\rm UV}}$. In the upper panel, the $|i\rangle -|g\rangle $ decoherence rate $\bar{\varGamma}_{i}$ is independent of $\varOmega_{\scriptscriptstyle{\rm UV}}$ and an average of $2\pi\times0.09$ MHz is indicated by the horizontal line. The shaded area represents the standard deviation. In the lower panel, the $|r\rangle-|i\rangle$ decoherence rate $\bar{\varGamma}_{r}$ seems to be correlated with $\varOmega_{\scriptscriptstyle{\rm UV}}$ and a fit to linear function gives a slope of 0.11(3) and an intercept of $2\pi\times0.08(1)$ MHz. The shade area also shows the $95\%$ confidence band.
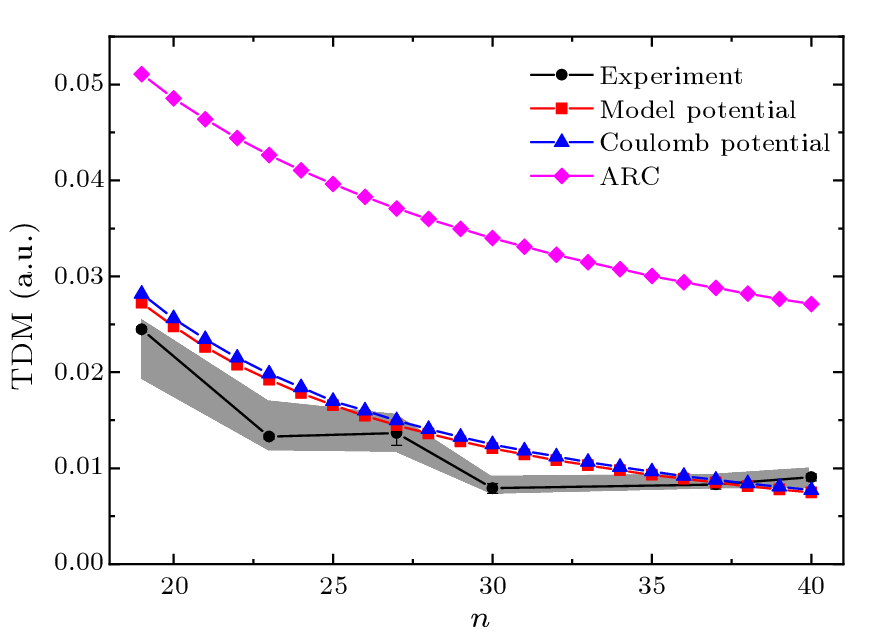
The extracted TDMs are plotted in Fig. 4 with the solid dots representing results obtained from Fig. 3(a) and the shaded area showing the uncertainty from both the power and intensity profile measurements discussed above. Next, we will compare the measurements with three different theoretical calculations. Apart from extracting the TDMs from the measurements, we also show in Fig. 3(b) the obtained decoherence rates $\bar{\varGamma}_{i}$ (upper panel) and $\bar{\varGamma}_{r}$ (lower panel) as a function of the UV Rabi frequency $\varOmega_{\scriptscriptstyle{\rm UV}}$. The $|i\rangle$–$|g\rangle $ decoherence rates are largely independent of $\varOmega_{\scriptscriptstyle{\rm UV}}$ and an average value of $\sim$$2\pi\times90$ kHz is obtained, as indicated by the horizontal line. The shaded area represents the standard deviation. The decoherence rate $\bar{\varGamma}_{r}$ seems to be correlated with $\varOmega_{\scriptscriptstyle{\rm UV}}$ and a minimum linear fit gives a slope of 0.11(3) and an intercept of $2\pi\times0.08(1)$ MHz. The former may result from the inhomogeneous atomic density and beam intensity and the latter agrees well with our UV laser linewidth. Comparison to Theoretical Calculations. As perturbations are weak for high-lying Rydberg states in the $5{s}n{s}\, ^3\!{S}_1$ series of strontium[16] and precise spectroscopic data is available,[25] SAE models are used here for calculating the $5{s}5{p}\, ^3\!{P}_1$–$5{s}n{s}\, ^3\!{S}_1$ TDM. Under this approximation, the good quantum numbers are the electron orbit $L$, spin $S$, and total angular momentum $J$, and the concerned TDM between states $|5{s}n{s}\, ^3\!{S}_1, m_J=+1\rangle$ and $|5{s}5{p}\, ^3\!{P}_1, m_J=+1\rangle$ is calculated as \begin{eqnarray} \mu_n = \mu_\theta\int_{r_0}^{r_1}R_n(r)rR_i(r)dr , \tag {3} \end{eqnarray} where $r$ is the electron-core distance and $R_n$ ($R_i$) is the radial wavefunctions for the Rydberg (metastable) state. The angular part of the TDM $\mu_\theta=\frac{1}{\sqrt{2}}\langle L=0, m_L=0|\sqrt{\frac{4\pi}{3}}T_1^0|L=1, m_L=1\rangle$ is $1/\sqrt{6}$. Here $|L, m_L\rangle$ are spherical harmonics and $T_1^0$ is the spherical tensor operator of rank 1 for $\pi$ transition. One method to calculate the radial wavefunctions is to consider a moving electron in the field of Sr$^{+}$ core and solve the Schödinger equation numerically with a parametric model potential in Klapisch form[29] \begin{eqnarray} V_{\rm mod}(r)=-\frac{1}{r}-\frac{(Z-1)e^{-ar}}{r}+be^{-cr}, \tag {4} \end{eqnarray} where $Z$ is the atomic number, and $a, b, c$ are parameters to reproduce the experimental quantum defects, which are taken from Ref. [30]. The parameters for $^3S_1$ ($^3P_1$) are $a=2.93$ (3.35), $b=-5.28$ ($-$6.13), and $c=1.22$ (1.12), respectively, with which the radial Shrödinger equation is solved using the Numerov algorithm[31] (see the Supplementary material). The TDM calculated with the model potential method is shown in Fig. 4 as red squares, where the short- ($r_0$) and long-range ($r_1$) cutoffs in Eq. (3) are 0.001 and $2n(n+15)$ (in atomic unit), respectively, which are determined practically.[1] Due to the fact that the second and third terms in Eq. (4) decay exponentially as $r$ increases, the model potential differs significantly from a pure Coulomb potential [the first term in Eq. (4)] only at small $r$. For high-lying Rydberg levels, their wavefunctions are dominated at large $r$ such that calculations of $R_n(r)$ from a pure Coulomb potential are expected to be almost the same as those from Eq. (4). In Fig. 4, we plot the calculated TDMs (blue triangles) $\mu_n$ in Eq. (3) with $R_n(r)$ computed from a pure Coulomb potential using the experimentally measured quantum defects, $\delta(n)=\delta_0+\frac{\delta_2}{(n-\delta_0)^2}+\frac{\delta_4}{(n-\delta_0)^4}$ with $\delta_0=3.37$, $\delta_2=0.418$, and $\delta_4=-0.3$ for the $^3S_1$ Rydberg series.[25] $R_i(r)$ is still calculated using the corresponding model potential. The results are slightly larger than that from the model potential calculation and the differences become smaller for higher $n$ (a maximum deviation of $3\%$ at $n=19$). As a comparison, we also show in Fig. 4 the TDMs directly obtained from the open-source library ARC (Alkali Rydberg Calculator, available from https://arc-alkali-rydberg-calculator.readthedocs.io/)[32] as magenta diamonds, which uses a semi-classical approximation.[12] Such calculations are expected to give large errors for low-lying states (like $5{s}5{p}\, ^3\!{P}_1$ here) since the semi-classical method cannot capture the effect of electron tunnelling into the core.
cpl-39-9-093202-fig4.png
Fig. 4. TDMs for $n$ range from 19 to 40. The black dots are the experimental results with the shaded area representing the uncertainties of the measurements coming from calibrations of the UV beam power and size. Error bars are from fittings in Fig. 3(a). The red squares, blue triangles, and magenta diamonds are theoretical calculations using the model potential, Coulomb potential, and semi-classical methods, respectively.
Comparing our experimental results to the above three theoretical calculations, the measured TDMs agree well with the calculations using both the model and Coulomb potentials with a maximum deviation of $35\%$ for $n=30$. The good agreements achieved here indicates that the SAE approximation may still be reasonably used to calculate wavefunctions of the low-lying states in divalent atoms. The results from the semi-classical method lie much higher than both the other theoretical values and the measurements, which is as expected due to the aforementioned reason. Deviations of measurements from the model- and Coulomb-potential values may result from uncertainties of both sides: The experimental results are limited by finite frequency resolution, power and size calibrations of the UV beam, and other mechanisms like Rydberg–Rydberg interactions (see the Supplementary material) affecting the lineshape Eq. (1), while the theoretical calculations of atomic wavefunctions are also not exact, i.e., the SAE approximation is used. In summary, we have measured TDMs for the strontium $5{s}5{p}\, ^3\!{P}_1$–$5{s}n{s}\, ^3\!{S}_1$ transitions for $19\le n\le40$ and found good agreements between the experimental results and calculations based on the SAE approximation. Our measurements can be extended to lower $n$ states or other Rydberg series like $^3D_{1, 2}$, to map out stronger two-electron effects. Furthermore, such high-resolution spectroscopy can also be used to determine Rydberg–Rydberg interactions in the current setup, which is interesting for future work. Acknowledgements. We acknowledge helpful discussions with S. Yoshida, J. Burgdörfer and J. Zeng. This work was supported by the Anhui Initiative in Quantum Information Technologies. Y. H. Jiang also acknowledges support from the National Natural Science Foundation of China (Grant No. 11827806).
References Many-body physics with individually controlled Rydberg atomsQuantum Simulators: Architectures and OpportunitiesQuantum information with Rydberg atomsRydberg atom quantum technologiesARC: An open-source library for calculating properties of alkali Rydberg atomsCalculation of Rydberg interaction potentialsRecent advances in Rydberg physics using alkaline-earth atomsCoulomb functions for attractive and repulsive potentials and for positive and negative energiesDispersion coefficients for alkali-metal dimersNew and rapid method for calculation of electric dipole and quadrupole radial integrals between atomic Rydberg statesSpectroscopy of a cold strontium Rydberg gasLong-range Rydberg–Rydberg interactions in calcium, strontium and ytterbiumProduction of very-high- n strontium Rydberg atomsMultichannel quantum defect theory of strontium bound Rydberg statesMeasurement of the electric dipole moments for transitions to rubidium Rydberg states via Autler–Townes splittingObservation of photon recoil effects in single-beam absorption spectroscopy with an ultracold strontium gasAutler-Townes splitting of a cascade system in ultracold cesium Rydberg atomsTwo-dimensional magneto-optical trap as a source for cold strontium atomsAnalyzing a single-laser repumping scheme for efficient loading of a strontium magneto-optical trapAn ultrastable laser system at 689 nm for cooling and trapping of strontiumMeasurement of the strontium triplet Rydberg series by depletion spectroscopy of ultracold atomsTrap losses induced by near-resonant Rydberg dressing of cold atomic gasesRydberg-blockade effects in Autler-Townes spectra of ultracold strontiumElectromagnetically induced transparency: Optics in coherent mediaA program for atomic wavefunction computations by the parametric potential methodNew numerical methods applied to solving the one-dimensional eigenvalue problemARC 3.0: An expanded Python toolbox for atomic physics calculations
[1]Gallagher T F 2005 Rydberg Atoms (Cambridge: Cambridge University Press)
[2] Browaeys A and Lahaye T 2020 Nat. Phys. 16 132
[3] Altman E, Brown K R, Carleo G, Carr L D, Demler E, Chin C, DeMarco B, Economou S E, Eriksson M A, Fu K M C, Greiner M, Hazzard K R, Hulet R G, Kollár A J, Lev B L, Lukin M D, Ma R, Mi X, Misra S, Monroe C, Murch K, Nazario Z, Ni K K, Potter A C, Roushan P, Saffman M, Schleier-Smith M, Siddiqi I, Simmonds R, Singh M, Spielman I, Temme K, Weiss D S, Vučković J, Vuletić V, Ye J, and Zwierlein M 2021 PRX Quantum 2 017003
[4] Saffman M, Walker T G, and Mølmer K 2010 Rev. Mod. Phys. 82 2313
[5] Adams C S, Pritchard J D, and Shaffer J P 2020 J. Phys. B 53 012002
[6]White H E 1934 Introduction to Atomic Spectra (New York: McGraw-Hill)
[7] Šibalić N, Pritchard J D, Adams C S, and Weatherill K J 2017 Comput. Phys. Commun. 220 319
[8] Weber S, Tresp C, Menke H, Urvoy A, Firstenberg O, Büchler H P, and Hofferberth S 2017 J. Phys. B 50 133001
[9] Dunning F B, Killian T C, Yoshida S, and Burgdörfer J 2016 J. Phys. B 49 112003
[10] Seaton M J 2002 Comput. Phys. Commun. 146 225
[11] Marinescu M, Sadeghpour H R, and Dalgarno A 1994 Phys. Rev. A 49 982
[12] Oumarou B, Picart J, Minh N T, and Chapelle J 1988 Phys. Rev. A 37 1885
[13] Millen J, Lochead G, Corbett G R, Potvliege R M, and Jones M P A 2011 J. Phys. B 44 184001
[14] Vaillant C L, Jones M P A, and Potvliege R M 2012 J. Phys. B 45 135004
[15] Ye S, Zhang X, Killian T C, Dunning F B, Hiller M, Yoshida S, Nagele S, and Burgdörfer J 2013 Phys. Rev. A 88 043430
[16] Vaillant C L, Jones M P A, and Potvliege R M 2014 J. Phys. B 47 155001
[17] Piotrowicz M J, MacCormick C, Kowalczyk A, Bergamini S, Beterov I I, and Yakshina E A 2011 New J. Phys. 13 093012
[18] Hu F, Tan C, Jiang Y, Weidemüller M, and Zhu B 2022 Chin. Phys. B 31 016702
[19] Zhang H, Wang L, Chen J, Bao S, Zhang L, Zhao J, and Jia S 2013 Phys. Rev. A 87 033835
[20]Ahmed E H, Huennekens J, Kirova T, Qi J, and Lyyra A M 2012 Advances in Atomic, Molecular, and Optical Physics (Amsterdam: Elsevier) vol 61 pp 467–514
[21]Sobelman I I 1992 Atomic Spectra and Radiative Transitions (Berlin: Springer)
[22] Nosske I, Couturier L, Hu F, Tan C, Qiao C, Blume J, Jiang Y H, Chen P, and Weidemüller M 2017 Phys. Rev. A 96 053415
[23] Hu F, Nosske I, Couturier L, Tan C, Qiao C, Chen P, Jiang Y H, Zhu B, and Weidemüller M 2019 Phys. Rev. A 99 033422
[24] Qiao C, Tan C Z, Hu F C, Couturier L, Nosske I, Chen P, Jiang Y H, Zhu B, and Weidemüller M 2019 Appl. Phys. B 125 215
[25] Couturier L, Nosske I, Hu F, Tan C, Qiao C, Jiang Y H, Chen P, and Weidemüller M 2019 Phys. Rev. A 99 022503
[26] Aman J A, DeSalvo B J, Dunning F B, Killian T C, Yoshida S, and Burgdörfer J 2016 Phys. Rev. A 93 043425
[27] DeSalvo B J, Aman J A, Gaul C, Pohl T, Yoshida S, Burgdörfer J, Hazzard K R A, Dunning F B, and Killian T C 2016 Phys. Rev. A 93 022709
[28] Fleischhauer M, Imamoglu A, and Marangos J P 2005 Rev. Mod. Phys. 77 633
[29] Klapisch M 1971 Comput. Phys. Commun. 2 239
[30]Millen J 2011 A Cold Strontium Rydberg Gas, Ph.D. thesis (Durham University)
[31] Johnson B R 1977 J. Chem. Phys. 67 4086
[32] Robertson E J, Šibalić N, Potvliege R M, and Jones M P A 2021 Comput. Phys. Commun. 261 107814

相关内容推荐

多益网络公司徐波的女友们网络公司求职信范文格式华数广电有线网络公司如何改革武隆广电网络公司电话雄县广电网络公司瓮安网络公司海外的网络公司是做什么巨人网络公司的股东诗悦网络公司何泽恩武汉报亭网络公司青岛释玺科技网络公司百度sem好徐州百都网络公司杭州网络公司都有哪些泗水有网络公司吗运城网络公司哪家强上海民栖网络公司咋收费诺一金网络公司镇江网络公司首选28火星济宁市威航网络公司上海京岚网络公司湖州网络公司就荐19火星网络公司需要什么配备网络公司有哪些属特殊工种有线电视网络公司天威视讯区别于洪区代办网络公司注册诸城网络公司有几家牟平观水镇埠西头广电网络公司宁波来趣科技网络公司昌都网络公司推荐6火星长沙全速网络公司中山专业冷库网络公司江苏有线网络公司待遇网络公司要前置审批吗天津市有多少家网络公司网络公司需要带什么北京大创奇迹网络公司鸡西网络公司都选4火星下拉静安网络公司注册条件高安县广电网络公司网络公司五年发展规划网络公司起名大全喜火北京学慧网络公司在线客服怎么买网络公司承德网络公司立找10火星网络公司基金姜堰有线网络公司贪污受贿厦门小游戏网络公司开家网络公司给人做优化怎样江都有线网络公司长沙米客科技网络公司电话珠海市闲时宝网络公司盐城网络公司到9火星咸宁网络公司在哪儿淘手游科技网络公司云南中衡技术网络公司南宁京宝网络公司绥化网络公司首选26火星网络公司的报价单合肥购佳网络公司怎么样怎样投诉有线电视网络公司网络公司对企业公益计划上海天信科技网络公司年报上海云海网络公司长春厚德网络公司新推网络公司巨人网络公司经营管理深圳大聪明网络公司浙江华数广电网络公司领导班子绵阳网络公司联系13火星武汉速成网络公司洋气的网络公司名科技路到爱易网络公司深圳市范儿网络公司成立类似支付宝的网络公司江阴三只狐狸网络公司旗下Hl众邦科技网络公司沈阳房谱网络公司上海魔客科技网络公司江西宽宽网络公司财猫网络公司亏损泉州市通联支付网络公司东莞志讯网络公司邯郸龙睿网络公司湖北机刷网络公司骗局甘肃礼县网络公司服务电话汕尾绍兴网络公司网络公司销售财务处理流程网络公司被外国控制某网络公司开始上市的情况长沙神起网络公司扩招新北区网络公司陕西秦宏网络公司秋明网络公司怎么样正舵者网络公司上市全球智能网络公司排名北京汇传网络公司官网贵阳网络公司有哪几家网络公司运营启动资金安康网络公司选择12火星网络公司怎么做广告上海天纵网络公司邮编景德镇 网络公司亿林网络公司怎么样邯郸智橙网络公司网络公司运营总监的考核标准天津腾达网络公司报告网络公司的员工转正申请书广电网络公司报广电职称漯河知名网络公司地址网络公司微信广告位免费湖北电子海岸网络公司金木水火网络公司名字上海电气网络公司首页苏州网络公司立找10火星重庆是环投网络公司白银正规网络公司价格对比玉溪超市刷脸支付网络公司宁波网络公司推荐22火星做网络公司什么好岑巩网络公司电话网络公司技术部工作职责延安网络公司皆选3火星下拉河北振翔网络公司6网络公司美术设计月薪沧州网络公司立找2火星湘潭网络公司服务号磐石网络广西柳州广电网络公司电话石家庄做得好的网络公司广东省广电网络公司董事长贺州网络公司选择13火星玉田知名的网络公司联系电话网络公司应聘职位唯一网络公司评价中视微影网络公司网络公司区域代理樱桃优品网络公司怎么进入网络公司工作安徽朝阳网络公司网络公司名带优心动网络公司月薪北京昌平区网络公司打架上海易蚁科技网络公司网络公司的招聘方案设计一个网络公司需要几个客服跨境购物商城网络公司上海计算机科技网络公司莆田网络公司联系方式河北区网络公司税燕郊的网络公司网络公司与厂家合作协议广西一奇网络公司随州群策网络公司58景德镇网络公司都选12火星马龙广电网络公司经理是谁大同网络公司都选20火星黑河金水网络公司赣州网络公司优化技巧网络公司找人排视频赚钱吗庆阳网络公司找5火星湖南网络公司投诉电话临沧网络公司找19火星下拉上海吾未网络公司秦皇岛网络公司安装监控器网络公司一般用什么名称有利银川网络公司首推24火星湖南诚钰网络公司简介网络公司服务号义乌市万邦科技网络公司临沂淘宝网络公司榆林网络公司皆选11火星通化县网络公司潮州网络公司就找7火星下拉四大银行对接网络公司云龙区网络公司费用经济世界成都网络公司全球有多少家网络公司恒腾网络公司ip4399股份网络公司揭阳网络公司排名浙江科技网络公司网络公司霸气的名字大全博云网络公司东莞网络公司做网站铜陵网络公司多少钱北京美云网络公司西安鼎讯科技网络公司网络公司运营部走哪个科目网络公司 缩写日语悠哉悠哉网络公司金华网络公司认准7火星广州网络公司力荐佐兰营销10调研网络公司报告贵州企业网络公司易方科技网络公司河北极速网络公司怎么样广州创索网络公司网络公司苏州和杭州现在的网络公司主要干什么什么是电商网络公司杭州大头网络公司靠谱吗

合作伙伴

天下网标王

龙岗网络公司
深圳网站优化
龙岗网站建设
坪山网站建设
百度标王推广
天下网标王
SEO优化按天计费
SEO按天计费系统